The M&L technology approach
Production Line Target and Actual Output Tracking System
A production monitoring project that compares target and actual output in real time and displays efficiency, scrap, remaining production and personnel data on a centralized dashboard.
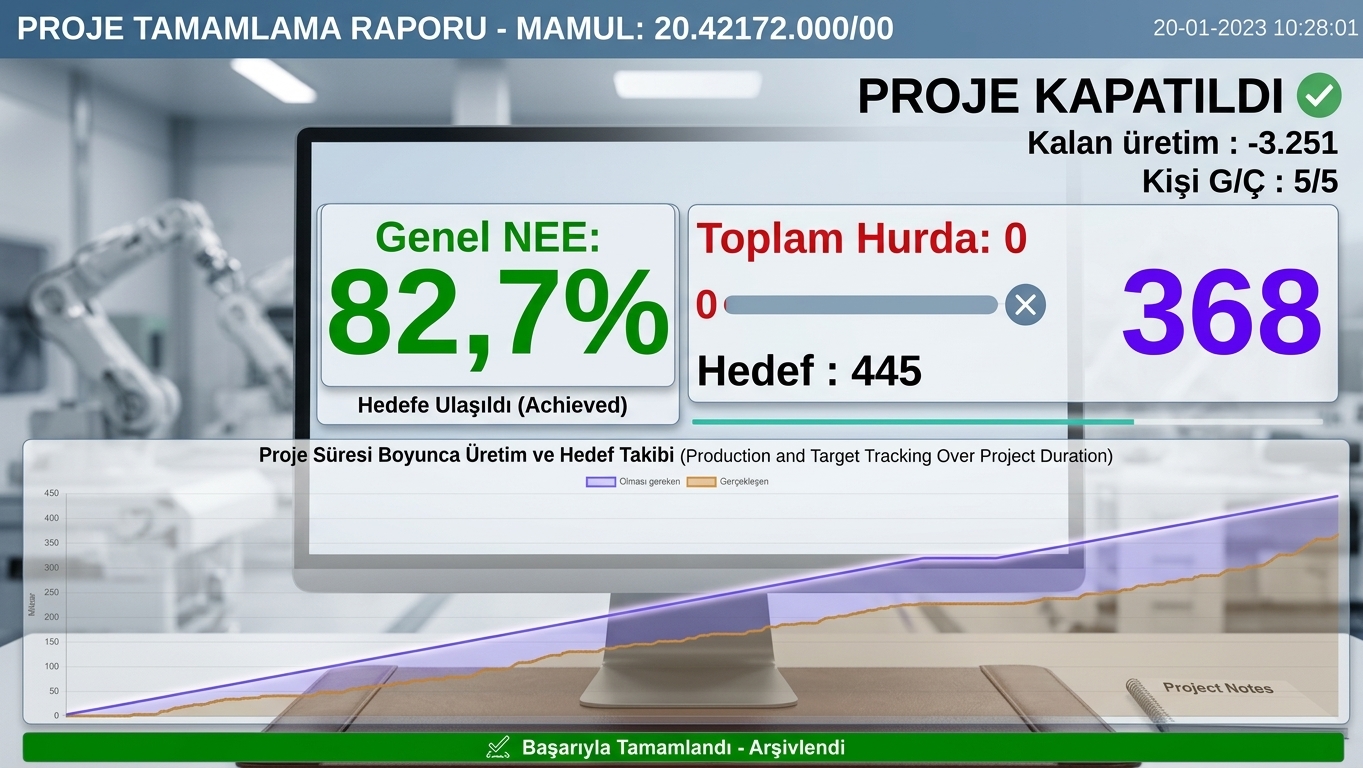
Within the scope of this project, a centralized production tracking and performance monitoring system was developed to compare planned targets with actual product quantities on production lines in real time.
Product count data collected from the production line is combined with work orders, shift targets, operating time, scrap quantities and personnel information. All data is displayed through clear visual indicators on large production-floor screens and a web-based management dashboard.
Target and Actual Production Counting
At the beginning of production, the product code, work order, target quantity, shift duration and planned production rate are transferred to the system. Every completed product is automatically recorded through sensors, PLCs, cameras, barcode systems or machine counters.
The actual production quantity is continuously compared with the target. Operators and managers can monitor the total target, completed quantity and remaining production from a single screen.
Target vs Actual Production Chart
The system displays the quantity that should be reached throughout the shift as a target curve. Actual production progress is plotted on the same chart in real time, making it easy to determine whether the line is ahead of or behind schedule.
Periods when production stops, slows down or falls below the target rate can be identified on the chart. This data supports the analysis of line stoppages, capacity losses and production bottlenecks.
Production Line Efficiency Monitoring
Real-time line efficiency is calculated by comparing actual production with the planned target. The efficiency rate is displayed as a percentage, while color-coded warnings can be generated according to predefined performance thresholds.
When the production rate falls below the target, operators and relevant managers can be notified. This enables corrective action to be taken before the shift ends.
Scrap and Defective Product Tracking
Scrap and defective products can be recorded through the PLC, quality inspection station, operator panel or camera system. The scrap quantity and its percentage of total production are calculated and displayed in real time.
Defective products can be classified by cause, machine, shift, operator and product type. These records help identify quality problems and recurring production defects.
Remaining Production and Estimated Completion Time
The system automatically calculates the remaining quantity by subtracting actual production from the target. An estimated completion time for the work order can also be calculated according to the current production rate.
If there is a risk that the production target will not be achieved within the planned shift, an early warning can be displayed. Personnel, machine and production schedules can then be adjusted in time.
Personnel and Shift Information
Through integration with personnel attendance systems, the planned and actual number of employees working on the line can be displayed. Personnel entry and exit data can be compared with shift performance.
The effects of personnel shortages, shift changes and break periods on production performance can be reported, making the relationship between workforce levels and production capacity measurable.
PLC and Machine Integration
The system can automatically collect data from PLCs, industrial sensors, encoders, photocells, barcode readers, AI-powered cameras and machine control systems. Product completion, machine operation, stoppage, fault and scrap signals are combined in a centralized database.
When the production target is reached, information can be sent to the PLC to stop the line safely, initiate a product changeover or notify the operator of the next work order.
Real-Time Production Dashboard
Production-floor screens can display the product code, date and time, shift, target quantity, actual output, remaining quantity, line efficiency, scrap quantity and active personnel count.
Screen colors can change automatically according to performance status. Normal production, below-target performance, line stoppages and critical deviations are presented in a format that operators can quickly understand.
Reporting and Historical Analysis
Production results are recorded by product, work order, machine, line, shift, operator and date. Daily, weekly, monthly and annual performance reports can be generated.
Target-to-actual differences, hourly output, stoppage durations, scrap rates and personnel efficiency can be reported. Data can be exported in Excel or PDF format and transferred to ERP, MES or business intelligence systems.
Project Benefits
- Real-time comparison of target and actual production
- Automated product counting using sensors, PLCs or cameras
- Live line efficiency and performance indicators
- Automatic calculation of remaining production
- Estimated work order completion time
- Scrap and defective product rate monitoring
- Comparison of planned and active personnel
- Identification of production losses and line stoppages
- Integration with ERP, MES, PLC and attendance systems
- Web-based centralized monitoring and detailed reporting
Community
Comments and questions
Nothing has been published yet.