The M&L technology approach
Production Control with Thermal Cameras
We combine thermal imaging, computer vision and artificial intelligence to analyze product temperature distribution and detect manufacturing defects automatically.
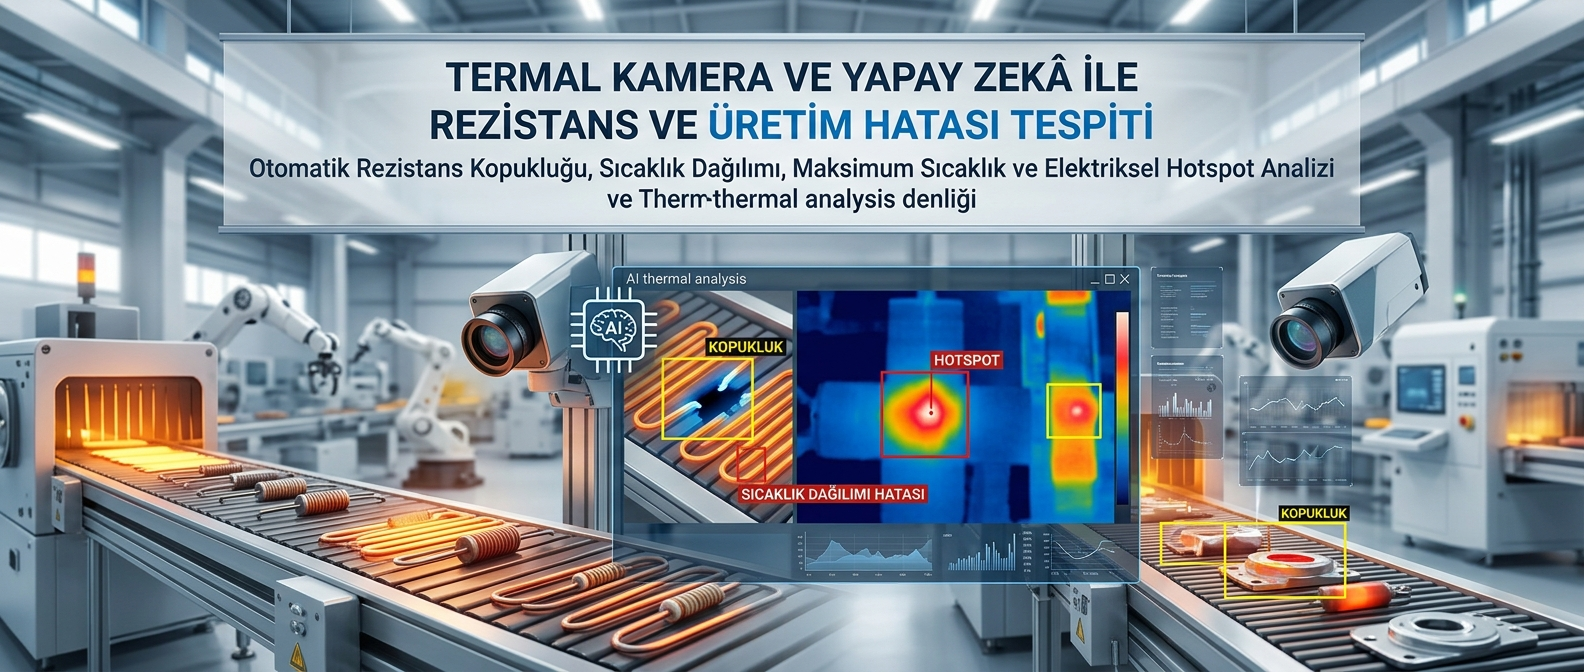
AI-Powered Production Inspection with Thermal Cameras
At M&L Technology, we combine thermal imaging, computer vision and artificial intelligence to develop systems that detect temperature-related quality problems automatically.
The thermal production-control system measures product surface temperatures without contact, analyzes heat distribution and classifies products as accepted or defective according to predefined quality criteria.
The system can be used for heating elements, electric heaters, electronic circuit boards, electrical panels, motors, bearings, cable connections and industrial products where temperature behavior is an important quality indicator.
Thermal images are not used only for visual monitoring. Temperature data contained in every pixel is analyzed to provide measurable, repeatable and reportable quality inspection.
Automated Quality Inspection for Heating Elements
The thermal camera monitors the heating behavior of an energized heating element in real time.
Temperature distribution, heating duration, maximum temperature, minimum temperature and regional temperature differences can be calculated automatically.
Wire discontinuities, connection faults, insufficient heating, irregular distribution and excessive temperature can be detected.
The product can be classified automatically as accepted or defective. Thermal images and measurement results can be stored with defect type, production time and product information.
Non-Contact Temperature Measurement
Thermal cameras detect infrared energy emitted by objects and measure temperature without physical contact.
This is beneficial for moving products, high-temperature objects, energized electrical equipment and products where physical sensors cannot be attached.
Products moving on a conveyor can be analyzed without stopping the production line.
Infrared Thermography
All objects above absolute zero emit infrared energy. Thermal cameras detect this energy and convert it into temperature values.
Temperature information is displayed as a thermogram or heat map using different color palettes.
The displayed colors represent measurable data. Software can read the temperature value of each pixel and perform mathematical analysis.
RAW Thermal Data Analysis
The system can process RAW radiometric data instead of treating thermal images only as JPG files or video.
Each pixel in a RAW thermal image contains measurable temperature information.
Maximum, minimum and average temperature and temperature-change rates can be calculated for selected areas.
This provides more measurable and repeatable results than systems based only on visual color comparison.
Automated Defect Detection
Acceptable temperature ranges and quality rules can be defined in the software.
Temperatures outside limits, areas that do not heat and irregular temperature distribution can be classified as defects.
Inspection rules can be customized according to product model, production recipe, test duration and environmental conditions.
Rule-based analysis and artificial intelligence can be used together.
AI-Powered Thermal Image Analysis
Artificial intelligence models can be trained using real thermal images of accepted and defective products.
The model learns complex heat-distribution patterns and can identify defects that may not be detected through simple threshold checks.
Separate defect classes can be created for discontinuities, insufficient heating, regional overheating, connection problems and non-uniform temperature distribution.
Maximum, Minimum and Average Temperature
Temperature values can be calculated for the complete product or selected inspection regions.
- Maximum temperature
- Minimum temperature
- Average temperature
- Temperature difference
- Heating duration
- Cooling duration
- Temperature-rise rate
- Regional heat distribution
These values can be compared with product-quality criteria automatically.
Heating Performance Analysis
The system can measure not only the final temperature but also how quickly the product reaches that temperature.
The temperature-rise curve is monitored after power is applied. Products that fail to reach the target temperature within the defined period can be rejected.
An unexpectedly rapid temperature increase may indicate excessive power, a connection problem or regional overheating.
Discontinuity Detection
Discontinuities in heating elements appear as areas that do not increase in temperature.
The software can compare expected heating regions with the actual thermal image and identify cold areas automatically.
The location of the discontinuity can be marked on the thermal image and added to the defect record.
Non-Uniform Heating Detection
Some product regions may become hotter or colder than others and create a quality problem.
The system compares selected regions and measures the uniformity of temperature distribution.
Temperature differences exceeding the defined tolerance can be recorded as non-uniform heating defects.
Overheating and Hotspot Detection
Regional overheating caused by electrical connections, short circuits, high resistance, loose connections and manufacturing defects can be identified automatically.
An area significantly hotter than its surroundings can be marked as a hotspot.
When a hotspot is detected, the process can stop, the operator can be alerted or a safe-control scenario can be initiated.
Product-Specific Inspection Recipes
Separate temperature and quality recipes can be prepared for different product models.
Inspection regions, expected temperature ranges, maximum temperature, minimum temperature, heating time and tolerances can be defined for each recipe.
The correct recipe can be selected automatically after scanning a product barcode or production order.
Image and Measurement Records
Visible images, thermal images and measurement results can be stored for every inspected product.
Product code, serial number, lot, production order, operator, date, time and result can be added to the record.
Defective products can be reviewed later by quality personnel.
Barcode and Serial-Number Integration
A barcode or QR code can be scanned before inspection to associate the thermal result with the correct product.
Serial number, lot, production order and customer information can be stored with the thermal measurement.
This provides product-level traceability.
PLC Integration
The thermal-control system can communicate bidirectionally with a PLC.
The PLC can notify the software when the product reaches the test station and can initiate product energization.
After analysis, the software sends an accepted or defective result to the PLC.
The PLC can control conveyors, separation mechanisms, warning lights and test stations according to the result.
Automated Product Separation
When a defective product is detected, a pneumatic cylinder, routing gate, robot or conveyor separator can activate automatically.
Accepted products continue along the production line while defective products are directed to a quality-inspection area.
Successful separation can be verified through sensor or PLC feedback.
NetRelay IoT Integration
NetRelay IoT devices can be used in projects without a PLC or where simpler control is required.
Thermal-analysis results can activate warning lights, sirens, fans and product-separation mechanisms through NetRelay relays.
Product sensors, test-start signals, door contacts and machine-fault information can be collected from digital inputs.
HTTP, MQTT, WebSocket and TCP can provide real-time communication between the analysis software and NetRelay.
SCADA and MES Integration
Thermal measurements and quality results can be transferred to SCADA and MES platforms.
Live temperature, product result, defect type, test duration and production quantity can be displayed centrally.
An alarm can be generated when the defect rate increases.
ERP Integration
Production orders can be collected from ERP and associated with thermal inspection records.
Inspected quantity, accepted quantity, defective quantity and defect reasons can be transferred to production records.
Integration with Logo GO Wings, Logo Tiger and other enterprise platforms can be designed according to available APIs, services and databases.
Web-Based Management Dashboard
Production and quality results can be monitored through a web-based dashboard.
Live temperature values, thermal images, accepted and defective quantities, defect rates and alarms can be displayed together.
Users can filter by date, product, serial number, production order, defect type and production line.
Operator Interface
A simple and fast operator interface can be prepared for the inspection station.
The operator can select a product recipe, scan a barcode and start the test.
The live thermal image, temperature values and remaining test time can be displayed.
The accepted or defective result can be shown clearly after completion.
Automated Reporting
Daily, weekly and monthly quality reports can be created automatically.
Reports can include total inspected products, accepted products, defective products, defect rate, maximum temperature, average temperature and defect types.
Reports can be generated in Excel or PDF and delivered automatically by email.
Statistical Quality Analysis
Collected thermal information can be analyzed by product, shift, machine, operator and production order.
Changes in defect rate, average temperatures and process deviations can be displayed through charts.
Quality problems related to shifts, raw materials and machine settings can be investigated.
Electrical Panel Thermal Analysis
Fuses, contactors, switches, busbars and cable connections can be monitored through thermal cameras.
Hotspots caused by loose connections, high contact resistance, unbalanced loads and excessive current can be detected early.
Maintenance personnel can be notified when temperature limits are exceeded.
Transformers and Energy Systems
Transformer connections, distribution panels and power lines can be inspected using thermal imaging.
Temperature differences between phases, overheating at connection points and cooling problems can be monitored.
PCB and Electronic Circuit Defect Detection
Temperature distribution across electronic components can be analyzed.
Short circuits, defective components, incorrect assembly, excessive current and design problems can create detectable temperature changes.
Small thermal differences can help identify the location of a defective component.
Motor, Bearing and Mechanical-System Analysis
Temperature changes in motors, bearings, gearboxes, pumps and rotating equipment can be monitored.
Abnormal heating caused by friction, insufficient lubrication, misalignment, overload and bearing damage can be detected.
Periodic measurements can be compared to monitor temperature trends.
Predictive Maintenance
Thermal imaging helps identify temperature changes before equipment failure occurs.
Normal operating temperatures can be learned and unusual increases can be treated as early warnings.
Maintenance can be planned according to actual equipment condition instead of only fixed schedules.
Building and Insulation Inspection
Thermal bridges, insulation defects, air leaks and damp regions can be visualized.
Temperature differences in walls and ceilings may help identify water leaks and areas at risk of mold.
Liquid and Gas Lines
Temperature distribution in hot-water, steam and gas lines can be monitored.
Blockages, leaks, insulation loss and steam-trap failures can be evaluated through thermal differences.
Fire and High-Temperature Warning
Temperatures exceeding defined limits in warehouses, production areas, electrical panels and machinery can be detected automatically.
The thermal image can be stored and authorized personnel can be notified.
The system does not replace certified fire-detection equipment and should be used as an additional monitoring layer.
Non-Destructive Testing
Thermal imaging allows products and equipment to be inspected without physical damage.
Sensors do not need to be attached to the product and the product does not need to be disassembled.
This is suitable for high-speed production and serial quality-control applications.
Environmental Conditions
Measurement accuracy can be affected by ambient temperature, emissivity, reflection, camera distance and viewing angle.
The correct emissivity value is defined according to the product material and the camera is calibrated.
Special camera angles, reference surfaces and protective enclosures may be used for reflective metal surfaces.
Thermal Camera Selection
The camera is selected according to temperature range, resolution, thermal sensitivity, lens, frame rate and communication capabilities.
Small electronic components and large industrial products may require different camera and lens configurations.
High-speed conveyors require a frame rate suitable for capturing product movement.
Field Analysis and Pilot Deployment
The product, production speed, temperature range, test duration, camera distance and environmental conditions are reviewed before implementation.
Thermal images are collected from accepted products and different defect types.
Inspection regions, acceptance criteria and defect classes are defined.
Detection accuracy, false alarms, missed defects, processing time and system stability are measured during the pilot.
Example Heating-Element Inspection
The operator scans the product barcode and the correct inspection recipe is selected.
The PLC energizes the product and the thermal camera begins monitoring temperature rise.
The software measures maximum, minimum and average temperatures in different regions.
If a discontinuity, insufficient heating, excessive temperature or irregular distribution is detected, the product is classified as defective.
The result is sent to the PLC and the product is routed to the reject station. Thermal images and measurements are stored with the serial number.
Example Electrical-Panel Monitoring
A thermal camera monitors connection-point temperatures inside an electrical panel.
When a contactor or cable connection becomes hotter than normal, a hotspot alarm is generated.
The alarm image, temperature, panel and equipment information are stored in the maintenance system.
Example PCB Inspection
The thermal image of an energized circuit board is compared with a known accepted board.
Components operating at abnormal temperatures and circuit regions that fail to heat are marked automatically.
The defect result is associated with the board serial number and transferred to the quality system.
Measurable Success Indicators
- Reduced manual temperature inspections
- Repeatable quality criteria for every product
- Automated detection of heating-element discontinuities
- Automatic maximum and minimum temperature measurement
- Detection of irregular heating and hotspots
- Automatic classification of accepted and defective products
- Automated removal of defective products
- Product-level storage of thermal images and measurements
- Transfer of quality results to ERP, MES and SCADA
- Earlier detection of electrical and mechanical faults
- Reduced unplanned equipment downtime
- Reduced manual reporting time
Why Use Thermal Cameras for Production Inspection?
Standard cameras can identify visible color, shape and assembly defects. Electrical and thermal problems inside a product may not be visible.
Thermal cameras measure operating heat behavior and reveal problems that cannot be seen by the human eye.
Computer vision, artificial intelligence, PLC and production-software integration transform temperature measurements into automated quality decisions and physical field actions.
A Thermal Inspection Project Customized for Your Business
Every product has different operating temperatures, surface materials, geometry, test duration and acceptance criteria.
Product samples, the production line, inspection time, temperature range, defect types and integration requirements are analyzed before development.
A pilot can begin with a limited product group. After thermal imaging, defect detection, PLC communication and reporting are validated, the system can be deployed across the complete production line.
For detailed information, visit the Thermal Camera Production Control and Defect Detection project page.
Community
Comments and questions
Nothing has been published yet.